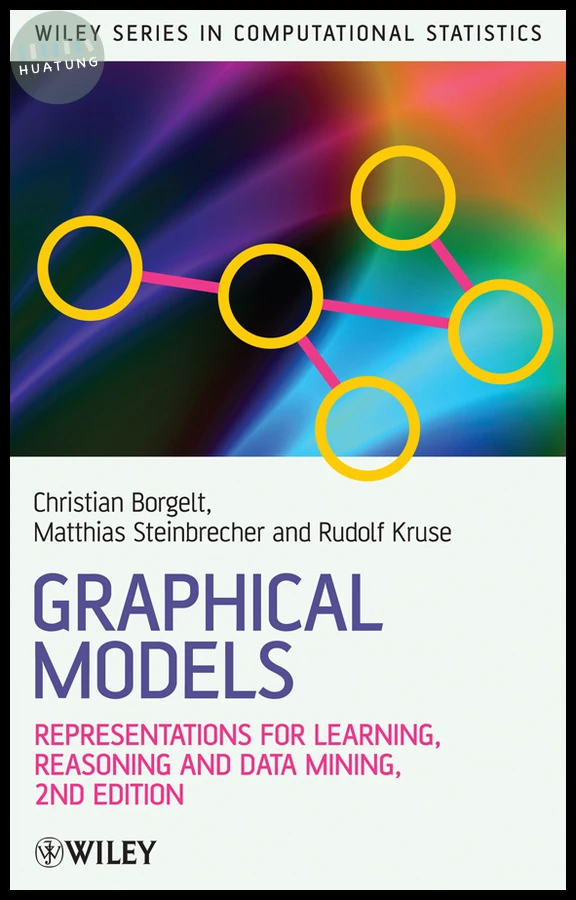
Graphical Models
$4338元 定價: $4820 9折 可訂購
簡介
Graphical models are of increasing importance in applied statistics, and in particular in data mining. Providing a self-contained introduction and overview to learning relational, probabilistic, and possibilistic networks from data, this second edition of Graphical Models is thoroughly updated to include the latest research in this burgeoning field, including a new chapter on visualization. The text provides graduate students, and researchers with all the necessary background material, including modelling under uncertainty, decomposition of distributions, graphical representation of distributions, and applications relating to graphical models and problems for further research.
目錄
Preface. 1 Introduction.
1.1 Data and Knowledge.
1.2 Knowledge Discovery and Data Mining.
1.3 Graphical Models.
1.4 Outline of this Book.
2 Imprecision and Uncertainty.
2.1 Modeling Inferences.
2.2 Imprecision and Relational Algebra.
2.3 Uncertainty and Probability Theory.
2.4 Possibility Theory and the Context Model.
3 Decomposition.
3.1 Decomposition and Reasoning.
3.2 Relational Decomposition.
3.3 Probabilistic Decomposition.
3.4 Possibilistic Decomposition.
3.5 Possibility versus Probability.
4 Graphical Representation.
4.1 Conditional Independence Graphs.
4.2 Evidence Propagation in Graphs.
5 Computing Projections.
5.1 Databases of Sample Cases.
5.2 Relational and Sum Projections.
5.3 Expectation Maximization.
5.4 Maximum Projections.
6 Naive Classifiers.
6.1 Naive Bayes Classifiers.
6.2 A Naive Possibilistic Classifier.
6.3 Classifier Simplification.
6.4 Experimental Evaluation.
7 Learning Global Structure.
7.1 Principles of Learning Global Structure.
7.2 Evaluation Measures.
7.3 Search Methods.
7.4 Experimental Evaluation.
8 Learning Local Structure.
8.1 Local Network Structure.
8.2 Learning Local Structure.
8.3 Experimental Evaluation.
9 Inductive Causation.
9.1 Correlation and Causation.
9.2 Causal and Probabilistic Structure.
9.3 Faithfulness and Latent Variables.
9.4 The Inductive Causation Algorithm.
9.5 Critique of the Underlying Assumptions.
9.6 Evaluation.
10 Visualization.
10.1 Potentials.
10.2 Association Rules.
11 Applications.
11.1 Diagnosis of Electrical Circuits.
11.2 Application in Telecommunications.
11.3 Application at Volkswagen.
11.4 Application at DaimlerChrysler.
A Proofs of Theorems.
A.1 Proof of Theorem 4.1.2.
A.2 Proof of Theorem 4.1.18.
A.3 Proof of Theorem 4.1.20.
A.4 Proof of Theorem 4.1.26.
A.5 Proof of Theorem 4.1.28.
A.6 Proof of Theorem 4.1.30.
A.7 Proof of Theorem 4.1.31.
A.8 Proof of Theorem 5.4.8.
A.9 Proof of Lemma .2.2.
A.10 Proof of Lemma .2.4.
A.11 Proof of Lemma .2.6.
A.12 Proof of Theorem 7.3.1.
A.13 Proof of Theorem 7.3.2.
A.14 Proof of Theorem 7.3.3.
A.15 Proof of Theorem 7.3.5.
A.16 Proof of Theorem 7.3.7.
B Software Tools.
Bibliography.
Index.