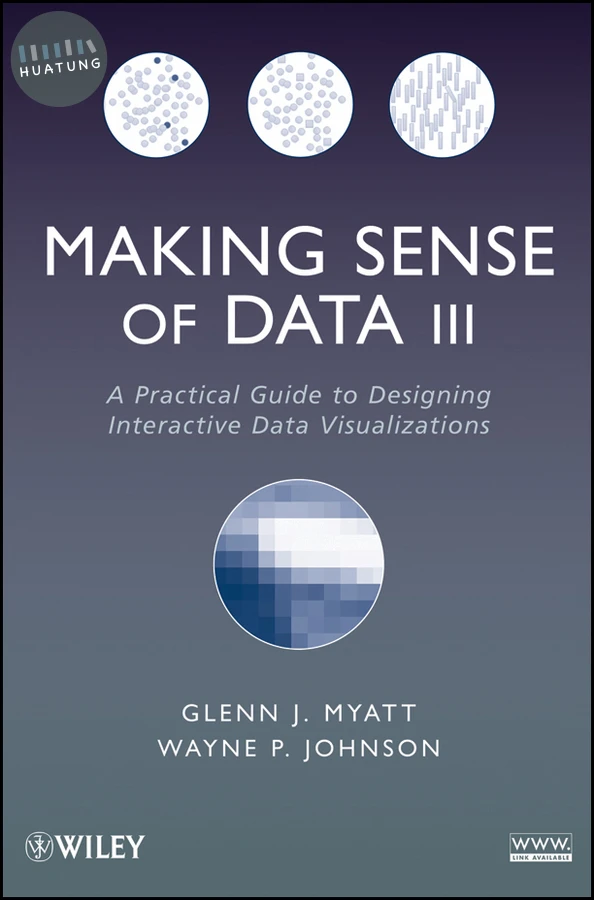

Making Sense of Data III
$3455元 定價: $3839 9折 可訂購
簡介
Focuses on insights, approaches, and techniques that are essential to designing interactive graphics and visualizations
Making Sense of Data III: A Practical Guide to Designing Interactive Data Visualizations explores a diverse range of disciplines to explain how meaning from graphical representations is extracted. Additionally, the book describes the best approach for designing and implementing interactive graphics and visualizations that play a central role in data exploration and decision-support systems.
Beginning with an introduction to visual perception, Making Sense of Data III features a brief history on the use of visualization in data exploration and an outline of the design process. Subsequent chapters explore the following key areas:
Cognitive and Visual Systems describes how various drawings, maps, and diagrams known as external representations are understood and used to extend the mind's capabilities
Graphics Representations introduces semiotic theory and discusses the seminal work of cartographer Jacques Bertin and the grammar of graphics as developed by Leland Wilkinson
Designing Visual Interactions discusses the four stages of design process—analysis, design, prototyping, and evaluation—and covers the important principles and strategies for designing visual interfaces, information visualizations, and data graphics
Hands-on: Creative Interactive Visualizations with Protovis provides an in-depth explanation of the capabilities of the Protovis toolkit and leads readers through the creation of a series of visualizations and graphics
The final chapter includes step-by-step examples that illustrate the implementation of the discussed methods, and a series of exercises are provided to assist in learning the Protovis language. A related website features the source code for the presented software as well as examples and solutions for select exercises.
Featuring research in psychology, vision science, statistics, and interaction design, Making Sense of Data III is an indispensable book for courses on data analysis and data mining at the upper-undergraduate and graduate levels. The book also serves as a valuable reference for computational statisticians, software engineers, researchers, and professionals of any discipline who would like to understand how the mind processes graphical representations.
目錄
Preface. 1. Introduction.
1.1 Overview.
1.2 Visual Perception.
1.3 Visualization.
1.4 Designing for High-throughput Data Exploration.
1.5 Summary.
1.6 Further reading.
2. The Cognitive and Visual Systems.
2.1 External Representation.
2.2 The Cognitive System.
2.3 Visual Perception.
2.4 Influencing Visual Perception.
2.5 Summary.
2.6 Further reading.
3. Graphic Representations.
3.1 Jacques Bertin: Semiology of Graphics.
3.2 Wilkinson: Grammar of Graphics.
3.3 Wickham: ggplot2.
3.4 Bostock and Heer: Protovis.
3.5 Summary.
3.6 Further reading.
4. Designing Visual Interactions.
4.1 Designing for Complexity.
4.2 The Process of Design.
4.3 Visual Interaction Design.
5. Hands-on: Creating Interactive Visualizations with Protovis.
5.1 Using Protovis.
5.2 Creating Code using the Protovis Graphical Framework.
5.3 Basic Protovis Marks.
5.4 Creating Customized Plots.
5.5 Creating Basic Plots.
5.6 Data Analysis Graphs.
5.7 Composite Plots.
5.8 Interactive Plots.
5.9 Protovis Summary.
5.10 Further Reading.
Appendix. A Exercise Code Examples.
Bibliography.
Index.