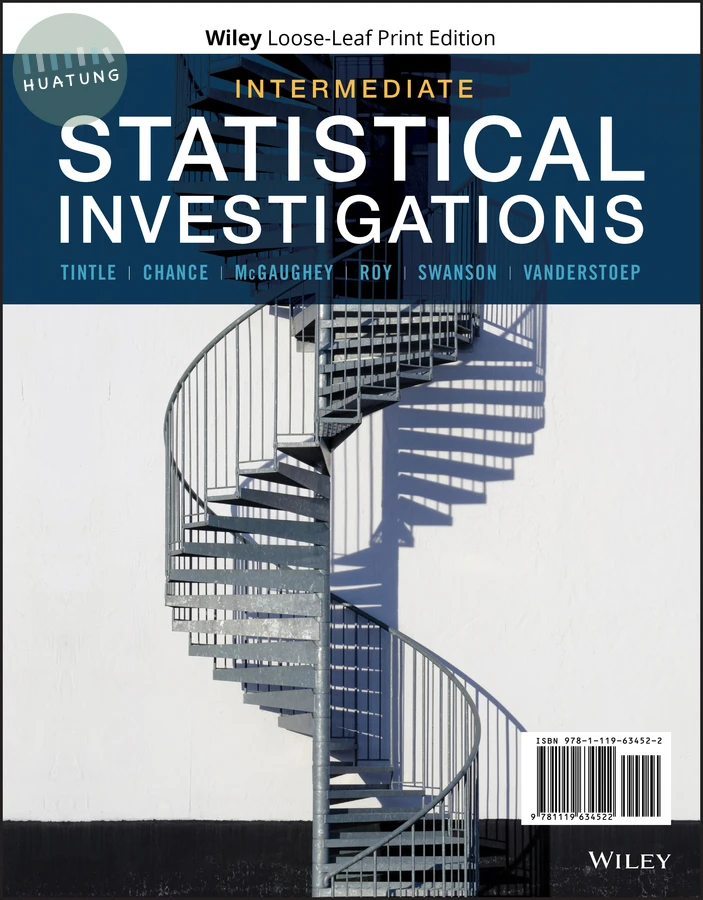
Intermediate Statistical Investigations
$4991元可訂購
簡介
Intermediate Statistical Investigations provides a unified framework for explaining variation across study designs and variable types, helping students increase their statistical literacy and appreciate the indispensable role of statistics in scientific research. Requiring only a single introductory statistics course as a prerequisite, the program uses the immersive, simulation-based inference approach for which the author team is known.Students engage with various aspects of data collection and analysis using real examples and clear explanations designed to strengthen multivariable understanding and reinforce first-course concepts.
Each chapter contains in-depth exercises which follow a consistent six-step statistical exploration and investigation method (ask a research question, design a study, explore the data, draw inferences, formulate conclusions, and look back and ahead) enabling students to assess a variety of concepts in a single assignment. Challenging questions based on research articles strengthen critical reading skills, fully worked examples demonstrate essential concepts and methods, and engaging visualizations illustrate key themes of explained variation. End-of-chapter investigations use real data from popular culture and published research studies in a variety of disciplines, exposing students to various applications of statistics in the real world. Throughout the text, user-friendly Rossman Chance web applets allow students to conduct the simulations and analyses covered in the book.
目錄
Preliminaries Multivariable Thinking and Sources of Variation 1
Example P.A: Graduate School Admissions at Berkeley 2
Exploration P.A: Salary Discrimination 9
Example P.B: Predicting Birth Weights 15
Exploration P.B: Housing Prices in Michigan 21
1 Sources of Variation 31
Section 1.1: Sources of Variation in an Experiment 32
Example 1.1: Scents and Consumer Behavior 33
Exploration 1.1: Memorizing Letters 40
Section 1.2: Quantifying Sources of Variation 44
Example 1.2: Scents and Consumer Behavior cont. 44
Exploration 1.2: Starry Navigation 50
Section 1.3: Is the Variation Explained Statistically Significant? 56
Example 1.3: Scents and Consumer Behavior cont. 57
Exploration 1.3: Starry Navigation cont. 65
Section 1.4: Comparing Several Groups 71
Example 1.4: Fish Consumption and Omega-3 72
Exploration 1.4: Golden Squirrels 83
Section 1.5: Confidence and Prediction Intervals 88
Example 1.5: Fish Consumption and Omega-3 cont. 89
Exploration 1.5: Golden Squirrels cont. 97
Section 1.6: More Study Design Considerations 101
Example 1.6: Fish Consumption and Omega-3 (revisited) 101
Exploration 1.6: Who Is Spending More Time Parenting on Average? 109
2 Controlling Additional Sources of Variation 138
Section 2.1: Paired Data 139
Example 2.1: Texts vs. Visual Distractions (Facebook vs. Instagram) 140
Exploration 2.1: Chip Melting Times 148
Section 2.2: Randomized Complete Block Designs 152
Example 2.2: What’s All the Fuss about Caffeine? 152
Exploration 2.2: Strawberry Storage 164
Section 2.3: Observational Studies with Two Explanatory Variables 173
Example 2.3: Salary Discrimination cont. 174
Exploration 2.3: Car Acceleration 182
3 Multi-factor Studies and Interactions 210
Section 3.1: Multi-factor Experiments 211
Example 3.1: Corporate Credibility, Endorser, and Purchase Intent 212
Exploration 3.1: Pig Growth 222
Section 3.2: Statistical Interactions 228
Example 3.2: Pistachio Bleaching 228
Exploration 3.2: Optimizing Ads 239
Section 3.3: Replication 248
Example 3.3: Optimizing Vitamin C 248
Exploration 3.3: Hurricane Names 257
Section 3.4: Interactions in Observational Studies 262
Example 3.4: Salary Discrimination revisited 262
Exploration 3.4: Hopelessness and Exercise 267
4 Including a Quantitative Explanatory Variable 294
Section 4.1: Quantitative Explanatory Variables 295
Example 4.1: Recovering Polyphenols from Grape Seed 295
Exploration 4.1: Fatty Acids and DNA 304
Section 4.2: Inference for Simple Linear Regression 308
Example 4.2: Recovering Polyphenols from Grape Seed cont. 309
Exploration 4.2: Fatty Acids and DNA cont. 317
Section 4.3: Quantitative and Categorical Explanatory Variables 322
Example 4.3: Michigan Housing Prices 323
Exploration 4.3: Predicting Height 332
Section 4.4: Quantitative/Categorical Interactions 338
Example 4.4: Michigan Housing Prices cont. 338
Exploration 4.4: FEV and Smoking 344
Section 4.5: Multi-level Categorical Variables 348
Example 4.5: Diamonds 348
Exploration 4.5: Patient Satisfaction 358
5 Multiple Quantitative Explanatory Variables 383
Section 5.1: Experiments with Multiple Quantitative Explanatory Variables 384
Example 5.1: Pistachio Bleaching 384
Exploration 5.1: Biodiesel 397
Section 5.2: Observational Studies with Multiple Quantitative Explanatory Variables 403
Example 5.2: Brain Size and IQ 403
Exploration 5.2: SLO Real Estate Data 410
Section 5.3: Modeling Nonlinear Associations Part I—Polynomial Models 414
Example 5.3: Arctic Sea Ice 414
Exploration 5.3: Kentucky Derby Winning Times 419
Section 5.4: Modeling Nonlinear Associations Part II—Transformations 421
Example 5.4: Salary Discrimination cont. 422
Exploration 5.4A: Stopping Distances 424
Exploration 5.4B: Kentucky Derby Winning Times cont. 426
6 Categorical Response Variable 447
Section 6.1: Comparing Proportions 448
Example 6.1: Encouraging Organ Donation 448
Exploration 6.1: Infant Attachment 460
Section 6.2: Introduction to Logistic Regression 465
Example 6.2: Smoking and Survival Rates 466
Exploration 6.2: Alcohol Abuse in Ukraine 472
Section 6.3: Multiple Logistic Regression Models 476
Example 6.3: Smoking and Survival Rates cont. 477
Exploration 6.3: Alcohol Abuse in Ukraine cont. 483
7 Practical Issues 503
Section 7.1: Dealing with the Messes Created by Messy Data 504
Example 7.1: Public Health Screening Data for the Omega-3 Index 504
Exploration 7.1: Evaluating the Impact of a Water Filter Intervention 516
Section 7.2: Multiple Regression with Many Explanatory Variables 524
Example 7.2: Predicting Real Estate Prices 524
Exploration 7.2: Predicting Changes in Omega-3 Index Values 536
Solutions to Selected Exercises 543
Index 579